Table of Contents
- What Data-Backed NFL Betting Systems Actually Do
- Building a Winning NFL Betting Model
- NFL Betting Model Backtesting: Testing Your Edge Before Real Money
- NFL Line Movement Analysis: Spotting Market Inefficiencies
- NFL Betting Picks Tracking Spreadsheet: Measuring What Actually Works
- The Reality of Profitability: Vig, Variance, and Realistic Returns
- Why Most Bettors Fail and How Data-Driven Strategy Prevents It
- Frequently Asked Questions
Last Updated: October 16, 2026
What Data-Backed NFL Betting Systems Actually Do
NFL betting systems are quantitative approaches to identifying betting opportunities where the market has mispriced the odds relative to the true probability of an outcome.
The difference between casual betting and professional betting comes down to one thing: discipline. A casual bettor might place a wager based on a team's recent performance or a quarterback's injury. A data-driven bettor places a wager only when the math supports it.
The core function of any data-backed NFL betting system is simple: find situations where the odds offered are better than the true probability of winning. If a team has a 55% chance of winning but the market is pricing them at 50%, that's an edge worth taking.
Most bettors fail because they chase narrative. They bet on the Super Bowl favorites because those teams are "better." They avoid Thursday night games because those teams are "tired." A system removes emotion. It says: here's what the data shows, and here's whether the odds match that reality.
Building a Winning NFL Betting Model
Building an NFL betting model starts with asking the right question: what variables actually predict wins and losses? Many bettors start by collecting every stat they can find, offensive yards, defensive yards, turnover ratio, red zone efficiency. That's a trap.
The best models start narrow. Pick one or two variables with proven predictive power. Team strength (based on win-loss record or Elo ratings) predicts outcomes reliably. Home-field advantage predicts outcomes reliably. Days of rest predicts outcomes reliably. Start there.
Here's the practical process:
- Define your hypothesis. What do you think predicts NFL outcomes? Write it down.
- Gather historical data. Pull game results, team stats, and betting lines for the past 3-5 seasons.
- Build the model. Use simple math at first. Assign weights to your variables. Calculate win probability.
- Test against history. Run your model on past seasons and see how often it picks winners.
- Calculate expected value. Account for the vig (the sportsbook's cut). Are your picks actually profitable after the vig?
Most bettors skip the last step. They see a 55% win rate and think they're profitable. They're not. A 55% win rate on -110 odds (standard NFL lines) is actually a losing proposition after vig.
The variables that matter most vary by sport and bet type. For NFL sides (picking winners), team strength and rest matter. For totals (over/under), weather and recent scoring trends matter. For moneylines, matchup data and key player injuries matter.
NFL Betting Model Backtesting: Testing Your Edge Before Real Money
Backtesting is where theory meets reality. It's the process of running your model against historical data to see whether your edge actually exists. Skip this step and you're gambling, not investing.
A proper backtest answers these questions: How many games does your model make picks on? What's the win percentage? What's the return on investment accounting for vig? How long is the longest losing streak? How does performance vary by season?
Here's how to backtest properly:
- Use multiple seasons. Test on at least 2-3 full NFL seasons. One season is too small a sample.
- Don't peek at results while building. Build your model on one season, then test on a different season. This prevents overfitting.
- Account for vig. Calculate returns as if you actually paid the sportsbook's cut. Most models look great until you do this.
- Track every pick. Log the date, team, line, odds, and result. This is your audit trail.
- Calculate confidence intervals. A 55% win rate over 100 games is noise. A 55% win rate over 1,000 games is signal.
Many bettors confuse backtesting with curve-fitting. They tweak their model until it works perfectly on historical data, then deploy it live and watch it fail. The model was overfit to past data. It had no real edge.
The honest truth: most models don't survive backtesting. If yours does, you've found something real. If it doesn't, you've saved yourself money by not betting real capital.
NFL Line Movement Analysis: Spotting Market Inefficiencies
Line movement tells a story. When a line moves, it means the market has new information or new money is pushing the line in a direction. Smart bettors read that story.
Here's what line movement reveals:
- Sharp money vs. public money. If a line moves against the public (away from the team everyone is betting), that usually means sharp bettors are betting the other side. Sharp bettors are usually right.
- Injury news. A line moves sharply when a key player is ruled out. If you catch that before the line adjusts, you have an edge.
- Closing line value. The line when a game closes (just before kickoff) is the market's final opinion. If you got better odds than the closing line, you had value. If you got worse odds, you didn't.
Tracking line movement requires accounts at multiple sportsbooks and the discipline to compare lines constantly. The sportsbooks move at different speeds. One book might adjust to a quarterback injury before another. That gap is where edges live.
NFL Betting Picks Tracking Spreadsheet: Measuring What Actually Works
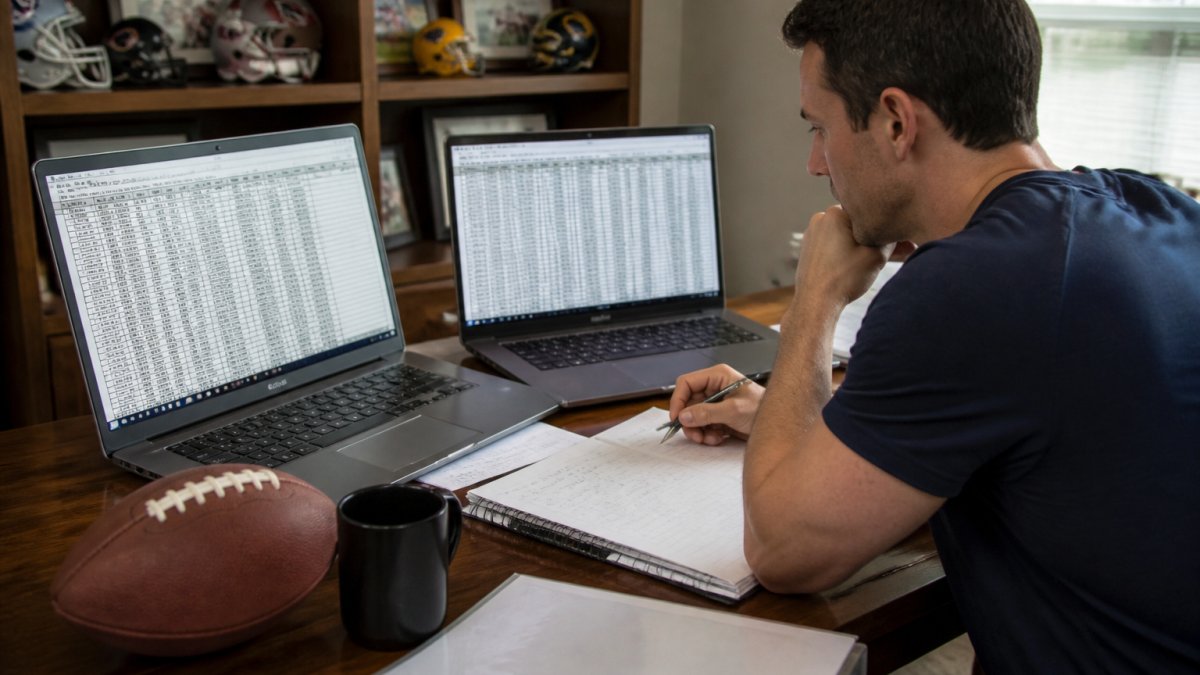
A tracking spreadsheet is non-negotiable. It's how you measure whether your system actually works. Without it, you're operating on memory and emotion.
Your spreadsheet should log:
| Column | What to Track |
|---|---|
| Date | Game date |
| Team | Which team you picked |
| Bet Type | Side, total, moneyline, etc. |
| Line | The odds you got |
| Stake | How much you wagered |
| Result | Win or loss |
| ROI | Return on that single bet |
| Notes | Why you made the pick |
Review this spreadsheet monthly. Calculate your win percentage. Calculate your return on investment. Identify which bet types are working and which aren't. Identify which seasons perform better than others.
Most bettors skip this because the data often shows they're losing money. That's exactly why you need to do it. You can't improve what you don't measure.
A tracking spreadsheet also prevents one of the biggest psychological traps in betting: cherry-picking. It's easy to remember your winners and forget your losers. A spreadsheet doesn't lie. It shows you everything.
The Reality of Profitability: Vig, Variance, and Realistic Returns
This is where most betting guides lie to you. They show you a model with a 55% win rate and suggest you'll be rich. That's not how it works.
The vig is the sportsbook's cut. On a standard -110 line, you need to win 52.4% of your bets just to break even. A 55% win rate sounds great until you realize you're only 2.6 percentage points above break-even.
Here's the math: if you bet 100 games at 55% win rate with -110 odds, you win 55 bets and lose 45. Your profit is 55 units minus 49.5 units (the vig on your losses) equals 5.5 units.
Variance is the other reality most guides ignore. Even a profitable system has losing streaks. A system that's +2% expected value can have a 20-game losing streak. That's not a sign the system is broken. That's variance.
A realistic expectation: a well-built system that captures real edges might return 5-15% annually after vig. That's good. It beats most active traders. But it requires discipline, proper bankroll management, and the ability to stick with the system through losing periods.
Why Most Bettors Fail and How Data-Driven Strategy Prevents It
Most bettors fail because they confuse prediction with profitability. They build a model that predicts winners at 55%. They think that's enough. It's not.
Here's why bettors fail:
- They don't account for vig. They see a 55% win rate and assume profit. They don't calculate that they need 52.4% to break even.
- They overfit their models. They tweak until the model works perfectly on past data, then deploy it live and watch it fail on new data.
- They chase losses. After a bad week, they increase bet sizes to recover. That's how bankrolls die.
- They don't track results. They remember winners and forget losers. They have no idea if they're actually profitable.
- They quit too early. A profitable system will have losing months. Most bettors quit before the system can prove itself.
A data-driven approach prevents all of this. It forces you to be honest about what works and what doesn't. It removes emotion from the decision-making process. It makes you measure results instead of trusting your gut.
Every pick is logged. Every result is tracked. Historical performance is transparent, no cherry-picking, no deleted losses, no excuses. That transparency is what separates a real system from a scam.
The data shows what's actually profitable. Not what feels right. Not what a famous analyst predicted. What the numbers actually show.
Building a data-backed NFL betting system takes time and discipline. It requires honest backtesting, disciplined tracking, and the ability to stick with your approach through losing periods. Most bettors won't do the work.
If you're serious about moving beyond casual betting, start by building a simple model based on team strength and home-field advantage. Backtest it on 3-5 seasons of data. Track every pick in a spreadsheet. Calculate your actual return after vig.
Sport Betting Edge offers real-time edge detection across NFL, MLB, and Golf, with full transparency on historical performance, immediate notifications when an edge appears, and access to professional sizing strategies. The 10-day free trial lets you test whether the system identifies edges you'd miss on your own. Research on sports betting market efficiency shows that consistent edge-finding requires access to real-time line data and historical validation, exactly what a data-driven platform provides.
Frequently Asked Questions
How do data-backed NFL betting systems actually beat the sportsbook?
Data-backed NFL betting systems identify market inefficiencies by analyzing factors sportsbooks may misprice: coaching changes, rest advantages, weather conditions, and historical performance splits. They don't guarantee wins, but they find situations where the probability of an outcome exceeds what the odds reflect. The key is testing these edges over a large sample size and only placing bets with positive expected value (+EV). Most recreational bettors lose because they chase narratives; systems win by being disciplined about probability.
What statistics matter most when building an NFL betting model?
The most predictive statistics vary by bet type, but generally include: team efficiency metrics (yards per play, turnover margin), coaching performance history, home-field advantage data, rest days and bye week effects, and recent form splits (home vs. away, against similar opponents). Advanced models also track quarterback health, defensive personnel changes, and weather conditions. The critical step is backtesting each statistic to confirm it actually predicts outcomes in your historical data before including it in your model.
How long should you backtest an NFL betting system before trusting it?
Minimum recommended sample size is 100-200 bets to see meaningful win rate trends, but 300+ bets across multiple seasons is more reliable for detecting real edges versus luck. A single season (16 games per team) is too small; variance can hide poor systems or mask lucky runs. Test across at least two full seasons if possible. Also track closing-line value (how your picks performed against the final odds), not just win percentage, since that reveals whether your model truly identified edges or just got lucky.
What should a betting tracking spreadsheet include to measure real results?
Track these columns: date, sport/league, bet type (spread, moneyline, total), team/pick, odds taken, odds at close, bet amount, win/loss, units won/lost, and ROI. Calculate win rate, average odds, units per bet, and cumulative ROI. Include closing-line value to see if you're beating the market or just getting lucky. Without closing-line tracking, you can't distinguish between a good system and variance. Review monthly and quarterly to spot seasonal patterns or declining accuracy.